.png)

These essential SMS marketing statistics prove why text messaging is a high-value channel for both brands and consumers.
Did you know that more consumers than ever are signing up for texts from their favorite brands? This trend isn’t surprising given their rising expectations for convenience and personalization. But opting in to SMS is also a way for consumers to stay in the know and make sure they don’t miss out on timely offers or product updates.
For brands, text messaging has evolved into a powerful, owned marketing channel that helps them strengthen their customer relationships, while also driving revenue and retention.
We've compiled a list of must-know texting statistics about why SMS marketing works, what makes consumers opt-in, how it improves the shopping experience, and more.
Don't forget to check out our roundup of the 9 resources you'll want to bookmark as you start your SMS journey!
The impact of text message marketing
Part of what makes text messaging so effective for marketers is its immediacy. They can reach their subscribers—and inspire them to make a purchase—within minutes. But it's also a direct channel to keep engaging with them after the sale and increase customer loyalty.
- Text messages have an average 97% read rate within 15 minutes of delivery.
- The average click-through rate for SMS is 20-35%.
- Shoppers who opt in to SMS are more likely to make a purchase: 63% of consumers who subscribe to at least one brand’s SMS marketing program have made a purchase from a text message within the last three months.

- Nearly 96% of marketers using text messaging say it's helped them drive more revenue, and almost 60% say it’s significantly or overwhelmingly increased revenue generation.
- 69% of marketers are using SMS for retention marketing in 2022, up 10% from 2021.
- 58% of marketers see a measurable impact on customer reengagement and retention after implementing SMS; 49% see an impact on customer acquisition.
- SMS is a top source for collecting first-party data: 81% of retailers either already use it to gather first-party data, or are planning to.
Consumer perspective on SMS marketing
Consumers have embraced text messaging to interact with brands. As SMS adoption continues to grow, it's important to understand consumers' preferences and why they see SMS as a high-value channel that improves their shopping experience.
Rising adoption
- 91% of consumers are interested in signing up for texts from brands.
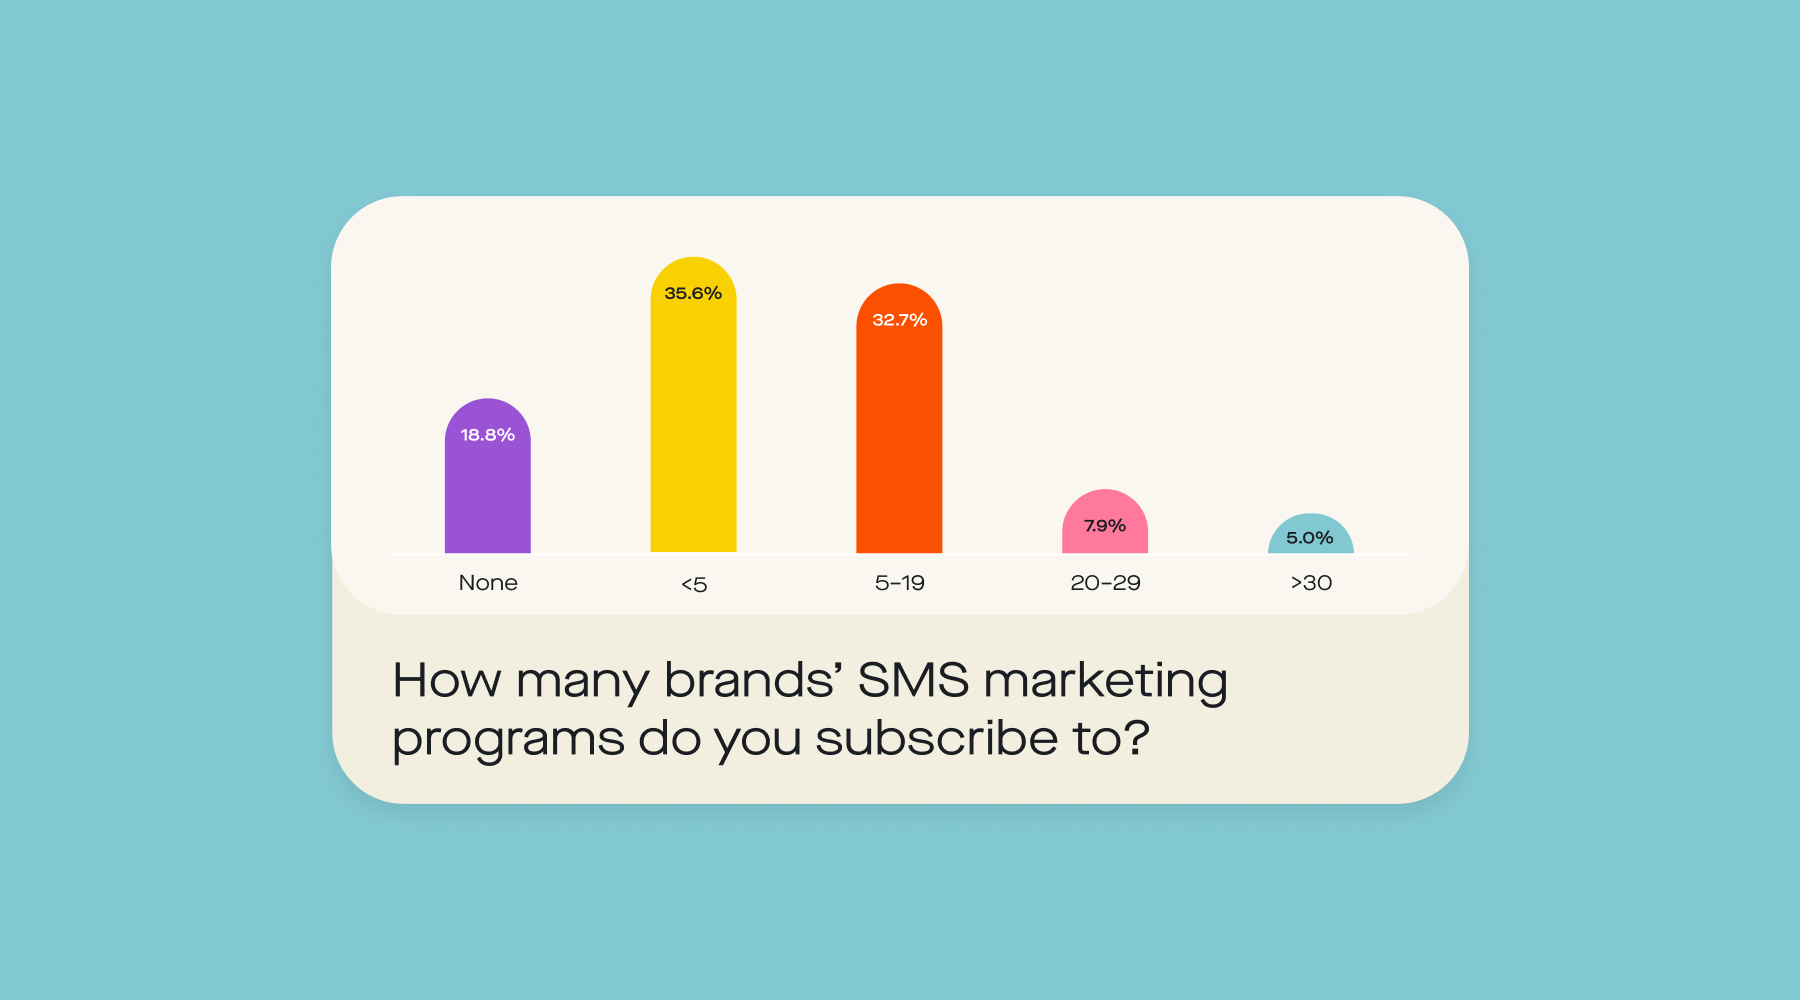
- 81.2% of consumers are opted in to at least one brand’s text message marketing program, but many are subscribed to more than one.
- From the end of 2020 to the end of 2021, the percentage of US consumers who opted into SMS marketing from brands increased by 26.1%.
- If international markets follow a similar growth trend, up to 60% of global consumers could be opted into SMS marketing programs by early 2023.
Sign-up incentives and messaging preferences
- Dollar-off discounts are consumers’ #1 preferred incentive when signing up for a brand’s text messages. Percentage-off discounts and free gift with purchase offers are both ranked at #2.
- But non-promotional incentives also work, with loyalty or rewards points ranked at #4, and access to exclusive discounts and entry into a giveaway tied at #5.
- Consumers are value-driven, ranking incentives/coupons and loyalty benefits as the top two types of marketing messages they’re interested in getting from brands.
- 58% of consumers want to hear from brands multiple times per week, while 18% say they’re open to getting marketing text messages once per day.
- 51% of consumers say they’re more likely to make a purchase if they receive text messages with images and media, while 33% say they don’t have a preference between SMS or MMS as long as the message contains relevant information.
Impact on the shopping experience
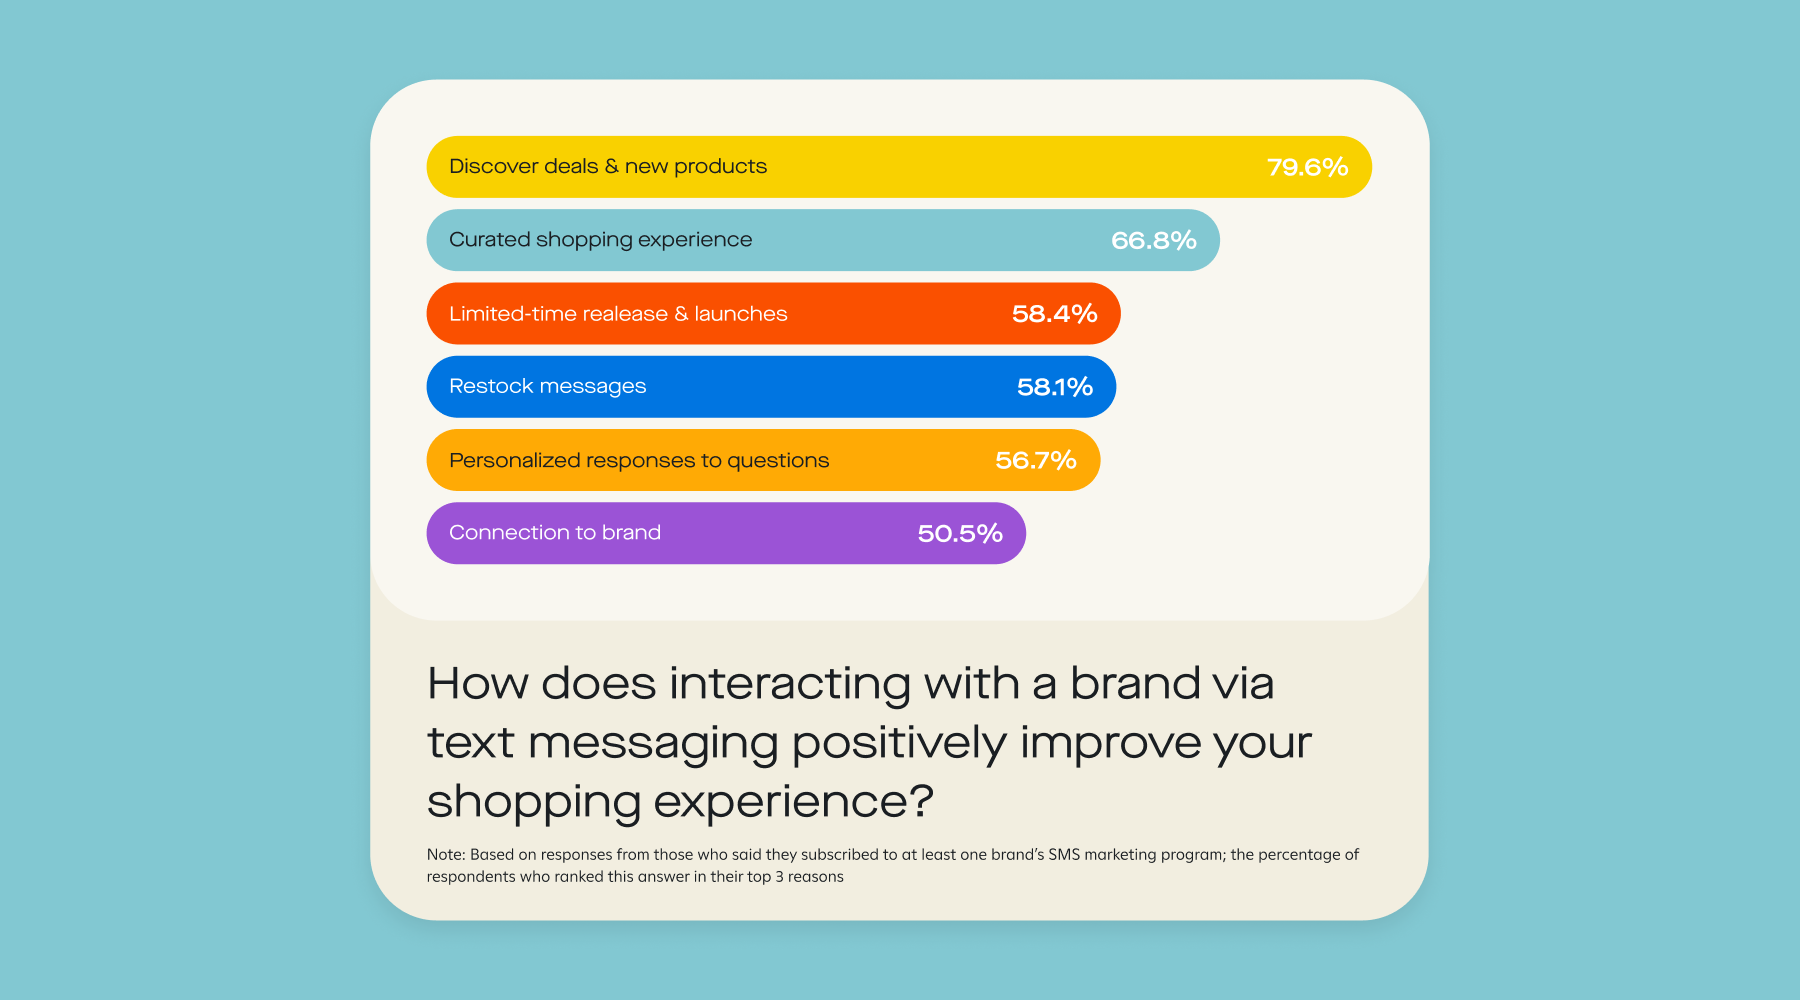
- Consumers say it’s easier to take advantage of deals and discover new products via SMS: 79.6% rank this as one of the top reasons opting in to a brand’s SMS program improves their shopping experience.
- Nearly 67% of consumers say they feel more in control of the brands they want to hear from via text and can better curate their shopping experience.
- 58% of consumers say getting restock alerts via text makes it easier for them to purchase previously sold-out products.
- 58.4% of consumers say getting texts about limited-time releases and new product launches allows them to act on deals faster.
Conversational commerce and the customer experience
SMS is a conversational channel that allows brands to engage shoppers in real-time—while they’re actively browsing—and help them make purchasing decisions faster. Not only are consumers open to texting back and forth with brands, but they also say it improves their overall customer experience.
- 30% of consumers reach out to a brand when they’re deciding what to buy, or if they have a question about sizing, material, or fit.
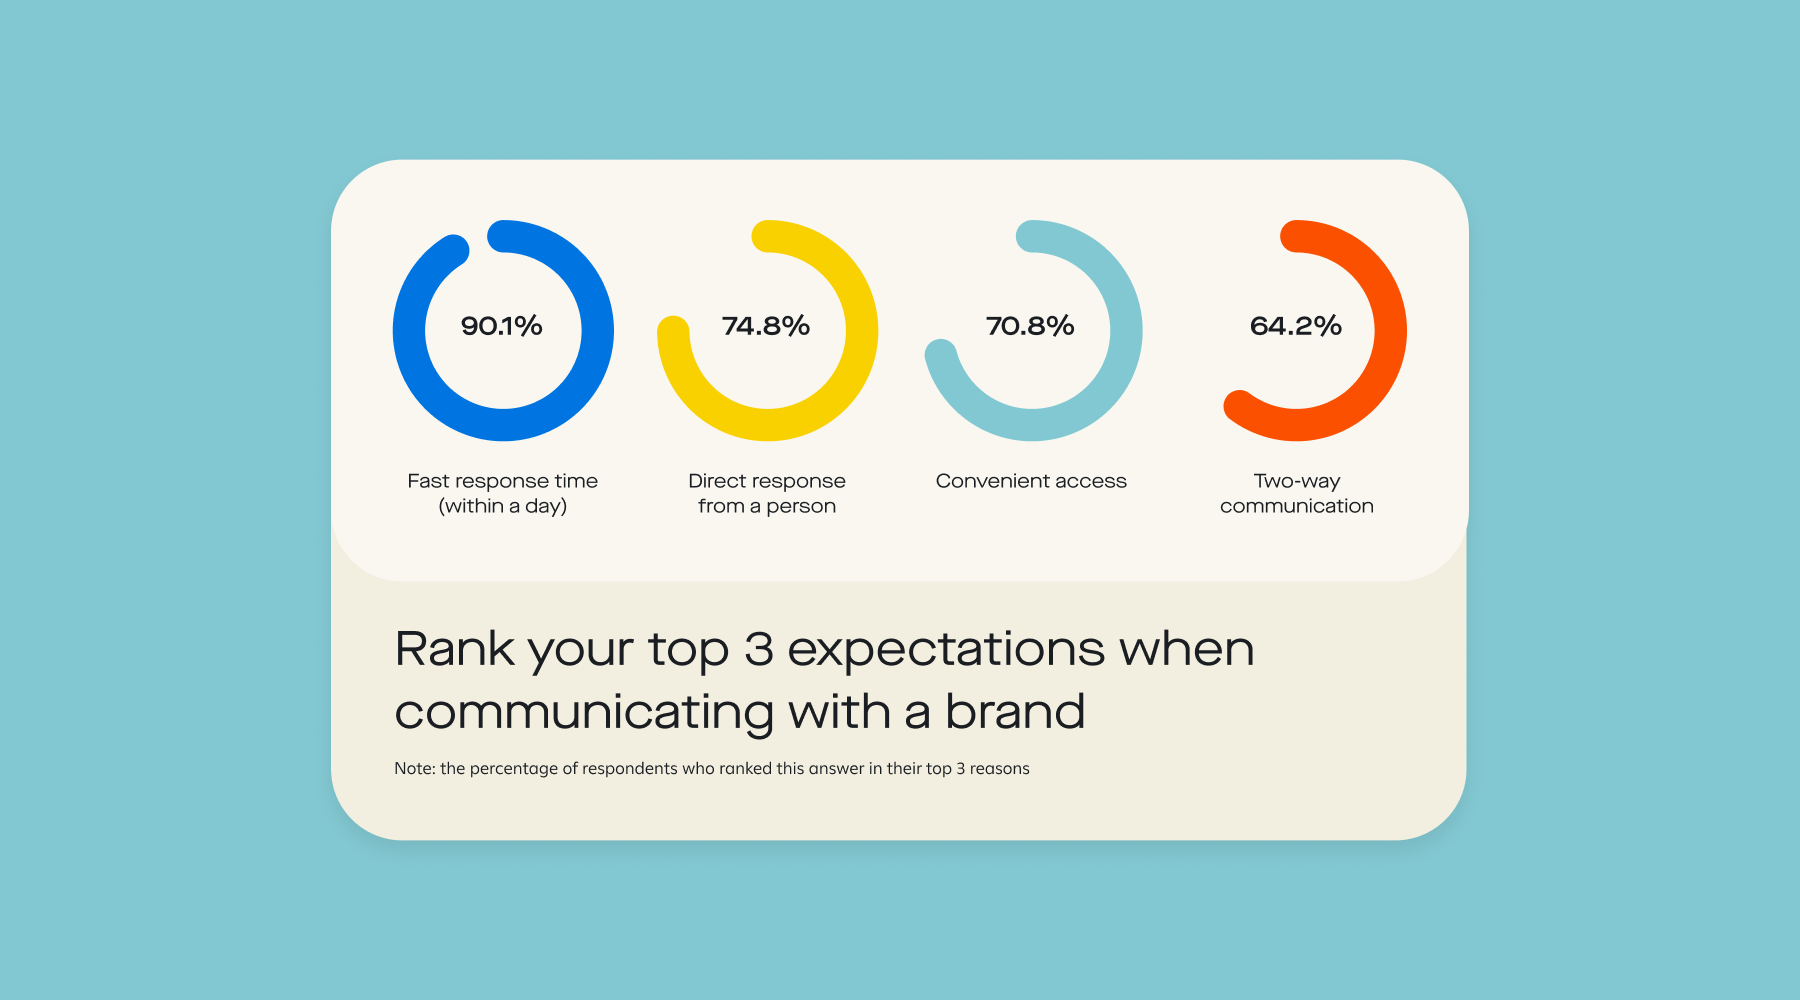
- Over 90% of customers expect a response within one day when they reach out to a brand, and 74.8% expect to hear back from a real person.
- 64.2% of customers also want the ability to have a back-and-forth conversation when communicating with a brand.
- Nearly 70% of consumers want to receive customer support from brands via SMS and get answers to their questions in real time.
- 56.7% of consumers rank "personalized responses" as one of the top three reasons SMS improves their shopping experience.
Retail trends and consumer shopping habits
The ebb and flow of industry trends often shape consumer behaviors and shopping habits. E-commerce is projected to rise steadily over the next few years, while consumers are expected to use their phones more and more to browse and buy.
- US retail e-commerce sales will grow over 12% annually from 2023 to 2026, and are estimated to account for over 21% of total US retail sales by 2026.
- 40% of US e-commerce sales will take place on mobile devices in 2023, and that share will continue to increase over the next few years.
- 41% of consumers shop online over six times a month.
- More than half of US adults shop online at least once a week, and 16% do so at least once a day.
- On average, 71% of people have used their mobile phone for shopping.
- 56.7% of consumers primarily use mobile when shopping online, with 36.7% using an equal mix of mobile and desktop. Only 6.7% primarily use desktops.
- Hybrid shopping isn’t just a trend: 89% of consumers participate in hybrid shopping at least some of the time.
Keep this list handy of over 35 essential e-commerce statistics that dig into the prevalence of mobile shopping, consumers’ habits and expectations, and more.


.png)