
The week after Cyber Monday is the only time your holiday data is still fresh and your Q1 plans are still open.
Most teams close out Black Friday and Cyber Monday by reporting a single top-line number, then table the deeper analysis until January. By then, the context is gone.
By January nobody will know what drove revenue, which journeys saw the most change in performance, how many subscribers signed up, or what should you do next to keep the momentum going. Q1 plans are usually set by then, so when you get these insights, you end up retrofitting what you learn into decisions you already made.
BFCM generates more usable marketing data than any other period of the year, and most of it is only reviewed once. In this post, we'll cover five questions worth asking with a conversational analytics tool while the data is still fresh, plus a 30-minute audit you can run with your team before the end of the year.
Note: In this post, “BFCM” refers to the five-day period from Thanksgiving through Cyber Monday.
Go deeper on BFCM performance while the context is fresh
Traditional reporting gives marketers a structured view of performance, but deeper analysis often means moving between reports, comparing time periods, and piecing together the story behind the numbers. Conversational analytics adds a new layer to that experience by letting marketers ask follow-up questions in the moment, explore what stands out, and keep digging while the context is still fresh.
Instead of stopping at the first result, teams can stay in the flow of analysis and move more naturally from what happened to why it happened and what to do next.
With Reporting Assistant you can ask about performance in plain language and get immediate answers back, along with charts, deeper analysis, and recommendations.
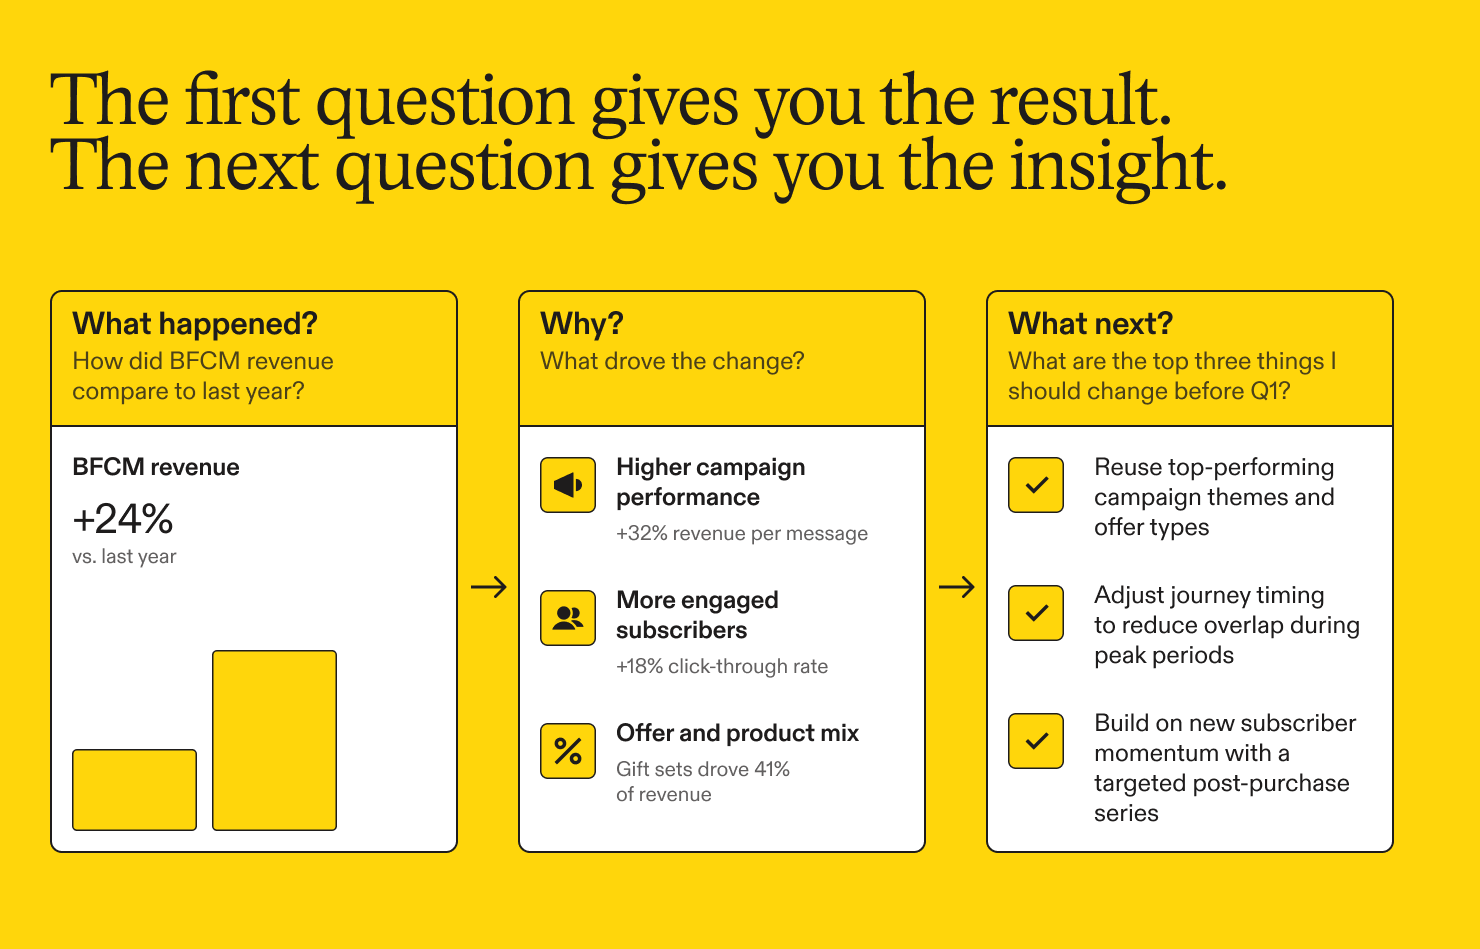
Five questions that turn BFCM data into a Q1 plan
1. What happened, beyond the revenue number?
Start wide. Get a read on the whole window before you commit twenty minutes to any one part of it.
Prompts to start with
- "Tell me my top 3 highlights and top 3 opportunities from the BFCM window compared to the same window last year."
- "How did revenue during the BFCM window compare to the previous four weeks, and to the same window last year?"
What you learn: whether the window outperformed, and which of the questions below deserves your attention first. If list growth jumped but revenue was flat, that points you somewhere different than if the reverse happened.
The pattern matters more than any single prompt. Ask broadly, read the answer, then follow the thread that has the most revenue attached to it. That second and third question is where the most useful material usually is.
2. Which campaigns earned their place?
BFCM creates a unique opportunity to compare a high volume of sends and see what resonated most with your audience.
Prompts to start with
- “Show me top products by campaign and journey from the last 14 days.”
- “What products were purchased from my most recent campaign?”
- “What products were purchased from my top revenue-generating journey?”
What you learn: which campaigns and journeys drove revenue, and which products they actually sold.
The product view is the one most teams never run, and it’s the one that changes next year’s merchandising plan. Knowing which products your top campaign moved, rather than how much revenue it generated overall, is the kind of finding that feeds next year’s plan.
3. What happened to your journeys under volume?
Journeys run all year and generate revenue without anyone touching them, which is exactly why nobody checks on them during the one week when campaign volume is high enough to crowd them out.
Prompts to start with
- “Compare my abandoned cart journey performance during BFCM to the 30 days before the window.”
- “Which journeys saw the biggest change in performance during the BFCM window, and what were the likely drivers?”
What you learn: whether your always-on programs held up, and where suppression and frequency caps need adjusting before the next peak.
One note on that second prompt. When the answer names likely drivers, those are areas worth investigating rather than settled causes. A journey that dipped during the BFCM window may have been suppressed, or it may have been competing with a better offer. The analysis points you at the question. You still answer it.
4. What did your new subscribers do next?
This is the question with the longest tail, and the one that determines whether BFCM was a good quarter or a good weekend.
Prompts to start with
- “How many subscribers did we add during the BFCM window, broken out by channel, and how does that compare to last year?”
- “Of the subscribers acquired during the BFCM window, how many have purchased since?”
- “Show subscriber growth and unsubscribes across the BFCM window in a chart.”
What you learn: whether peak-season acquisition is converting or inflating the list, and what the unsubscribe cost of the window was.
Both halves matter. A list that grew sharply and then sat still is a different situation than one that grew less and started buying, and the post-BFCM retention plays you run in December depend on knowing which one you have.
5. What should change before the next BFCM?
The first answer is just the first step towards a full plan. These are the follow-ups worth asking once you have the picture.
Prompts to start with
- “Based on this analysis, what are the top three things I should change before next peak season?”
- “Which of these findings should inform Q1 campaign planning?”
- “Turn this into a chart and summarize the takeaways for a stakeholder update.”
What you learn: a prioritized list you can argue with, which is more useful than a comprehensive one you can't.
That last prompt earns its place. Most of this analysis ends up in a recap deck anyway, and producing the summary is part of the work rather than a separate chore afterward.
Pro tip: Run one of these against a number you already reported during the window. If the figures line up, you'll trust the rest of the session. If they don't, you've found a metric definition worth sorting out before it reaches a stakeholder deck.
Your 30-minute audit agenda
Block half an hour, ideally with whoever owns reporting and whoever owns the calendar. The sequence below moves from wide to narrow and ends with something you can act on.
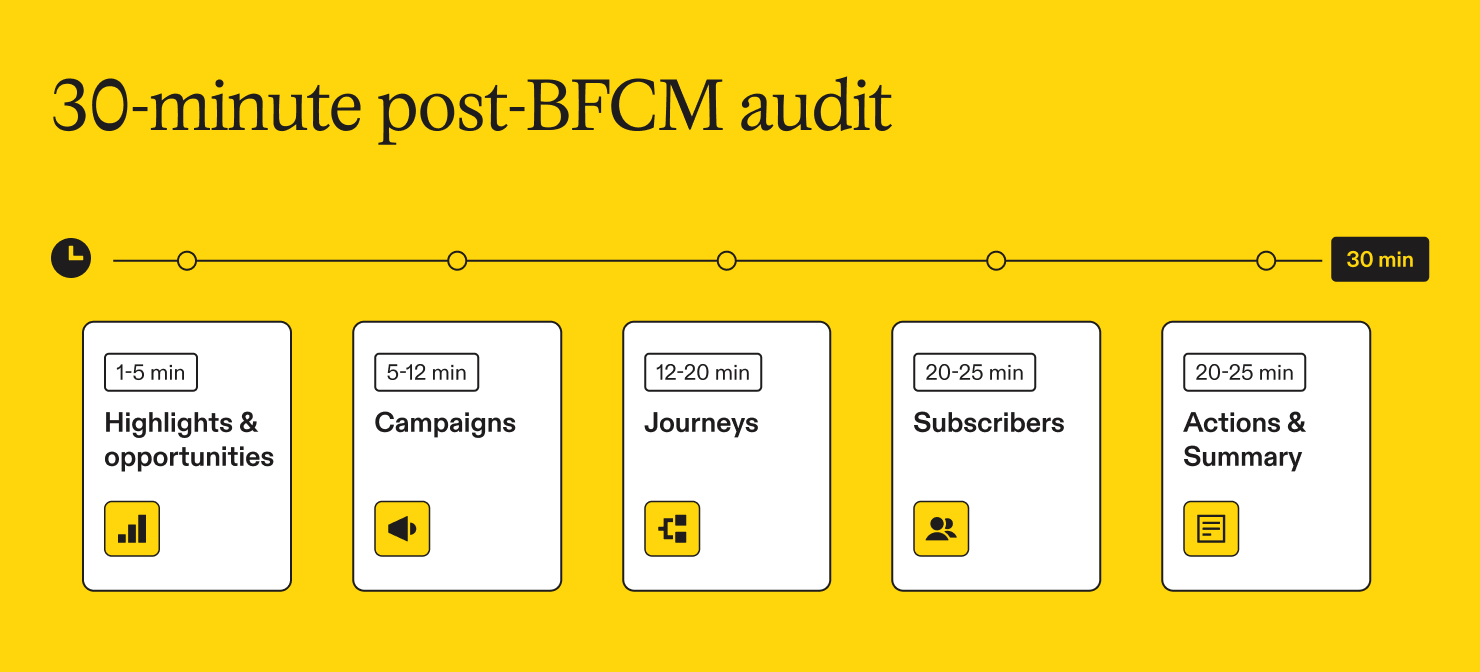
- Minutes 1 to 5. Top highlights and opportunities against last year's window
- Minutes 5 to 12. Campaigns and journeys ranked by revenue, plus the products they sold
- Minutes 12 to 20. Journey performance during the window compared to the 30 days before
- Minutes 20 to 25. Subscriber growth and unsubscribes, plus how many of the new subscribers have purchased
- Minutes 25 to 30. The top three changes, and the stakeholder summary
Thirty minutes gets you further than a January deep dive, mostly because the people in the room still remember what happened.
The analysis you run now is the plan you have in January
Teams that review in December walk into Q1 with a plan shaped by what happened. Teams that review in January walk in with last year's plan and a report that confirms it was fine.
BFCM might be over, but the data is still working for you.
Join the Reporting Assistant beta